
Excel Compare Sheets: Changed, New and Removed Rows in One Report
You have two versions of the same spreadsheet. Last month’s price list and this month’s. The budget before the meeting and the budget after it. A customer file you sent out and the copy that came back. Somewhere in there, a few values changed, a row or two disappeared and something new was added, and you need to know exactly what. Compare Sheets in Dose for Excel lets you compare two Excel sheets without formulas or helper columns. It lines them up for you and gives you a clear report of every difference: what changed, what’s new and what was removed, with the old value next to the new one.
It works whether your rows are in the same order or completely shuffled, and whether the two sheets are in the same workbook or in two separate Excel files. Your original sheets are never touched.
Why Comparing Spreadsheets by Eye Doesn’t Work
When you compare two Excel sheets with twenty rows, you can put the two worksheets side by side and squint. With two thousand you can’t, and the changes that matter are usually the small ones: a price that moved from 289 to 269, a stock count that dropped, a supplier that quietly vanished from the list. Miss one of those and it ends up in an invoice or a report.
The usual workarounds all fall short somewhere:
- Excel’s View Side by Side scrolls two windows together, but you still have to find every difference by eye.
- A formula like =A2<>Sheet2!A2 only works if every row is in exactly the same place. Insert one row, or sort one sheet differently, and everything below it shows up as “different”.
- VLOOKUP or XLOOKUP helper columns can match rows by an ID, but you need one lookup per column you want to check, then a filter to find the mismatches, and nothing tells you which rows were added or removed.
- Conditional formatting rules highlight cells that differ, but they don’t give you a list you can read, filter or send to someone else.
When you compare two Excel sheets with this tool, it does the matching, the checking and the listing in one go, and hands you the answer as an ordinary workbook.
What This Excel Sheet Comparison Tool Gives You
- Two ways to line up rows. Based on Column matches rows by a value that identifies them, such as a product code, an invoice number or an employee ID, so the order of the rows doesn’t matter. Peer to Peer compares row 5 with row 5, for sheets that keep the same layout.
- Every kind of change. Changed values, new rows and removed rows are all found and counted.
- A report you can read. The results open in a new workbook with a summary line, then one line per difference showing the row, the column, the old value and the new value.
- Go links. Every line in the report has a Go link that takes you straight to that cell.
- Highlighted copies of both sheets. The report workbook also holds a copy of each sheet that highlights the differences in your colors, so you can see them in context.
- Your colors. Pick one color for updated values, one for new rows and one for removed rows.
- Same workbook or different files. Compare two sheets in the workbook you have open, or pick either sheet from another file without opening it yourself.
- Your originals stay as they are. Compare Sheets only reads the two sheets. Nothing in them is changed, colored or moved.
- Case Sensitive option. Decide whether ABC and abc count as a difference.
- No cap on the number of differences. If a report would fill a whole sheet, it simply continues on a second report sheet.
- Remember my settings. Save your choices so the pane opens the way you left it, or reset it from the same menu.
- Works with Excel 2010, 2013, 2016, 2019, 2021, 2024 and Microsoft 365, 32-bit and 64-bit. The interface is available in multiple languages.
How to Compare Two Excel Sheets for Differences (Step by Step)

- Go to the DOSE tab and click Compare Sheets. The Compare Sheets pane opens on the right.
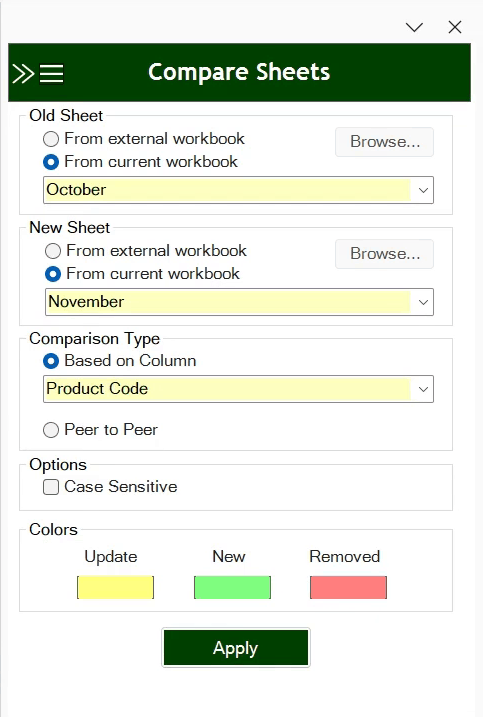
- Under Old Sheet, choose where the older version is: From current workbook, then pick the sheet from the list, or From external workbook, then click Browse… and choose the file.
- Under New Sheet, do the same for the newer version.
- Under Comparison Type, choose Based on Column and pick the column that identifies each row, or choose Peer to Peer if the rows haven’t moved.
- Tick Case Sensitive if capital letters matter in your data.
- Click each box under Colors to choose the colors for updated values, new rows and removed rows.
- Click Apply. A message asks you to confirm that both sheets have the same columns; click Yes, and the report opens in a new workbook.
Based on Column: When the Rows Have Moved
Most real lists don’t stay in the same order. Someone sorts by name instead of by code, new items get added in the middle, discontinued ones get deleted. Comparing row by row is useless then, because every row after the first change looks different.
Based on Column solves that when you compare two Excel sheets with shuffled rows. You pick a column whose values identify each row, and Compare Sheets finds each row in the other sheet by that value, wherever it sits. Rows found in both sheets are checked column by column. A value that exists only in the old sheet is reported as Removed, and one that exists only in the new sheet as Added.
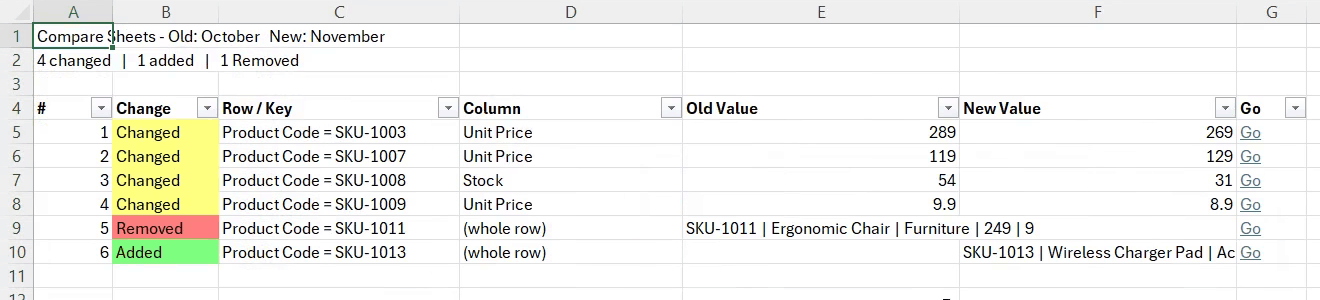
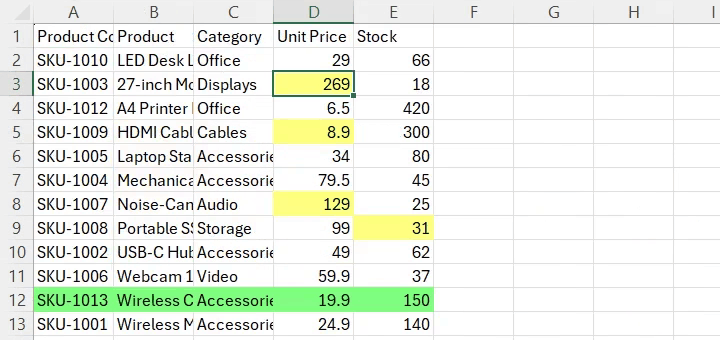
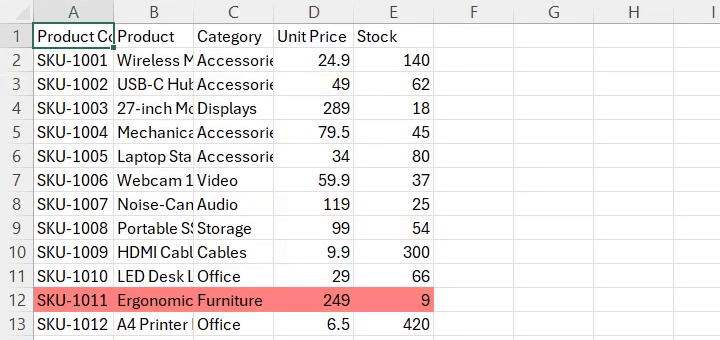
In the example below we have a price list for October and one for November in the same workbook. November is sorted by product name, so the rows are in a different order. Between the two months, three prices and one stock count changed, the Ergonomic Chair was dropped and a Wireless Charger Pad was added.
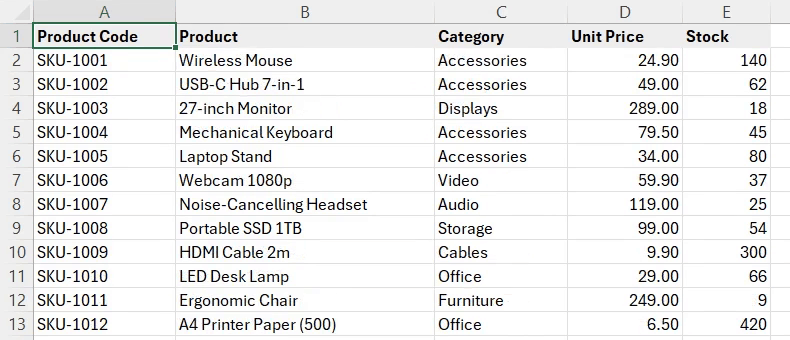
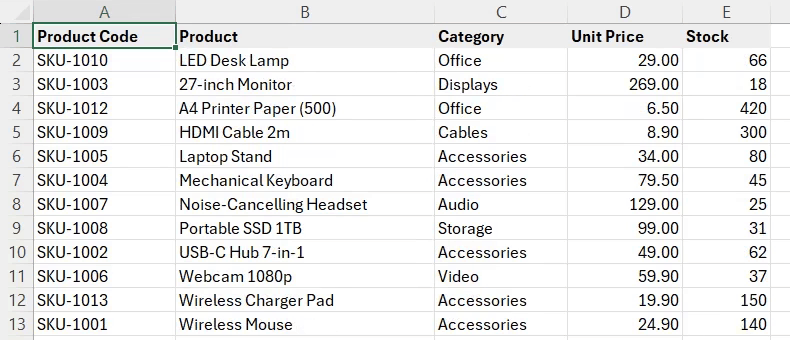
We chose From current workbook for both, picked October as the old sheet and November as the new one, selected Based on Column and chose Product Code from the list, set light yellow, green and red as the colors, then clicked Apply and Yes.
The report found all six differences, even though no row is where it used to be:
Peer to Peer: When the Layout Stays the Same
Some sheets are templates. A budget, a timesheet, a monthly KPI sheet: the same lines in the same places every time, and only the numbers change. To compare two Excel sheets like those, you don’t need a matching column. Peer to Peer compares each cell with the cell in the same position on the other sheet. Extra rows at the bottom of the new sheet are reported as Added, and rows that are missing from the bottom as Removed.
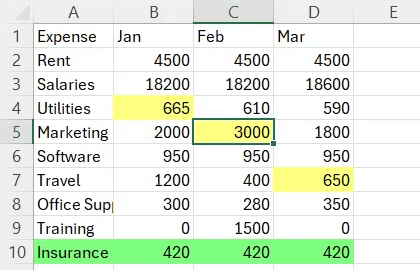
In the example below we have two versions of a quarterly budget, Budget v1 and Budget v2. In v2, the January utilities bill, the February marketing spend and the March travel figure were revised, and a new Insurance line was added at the bottom.
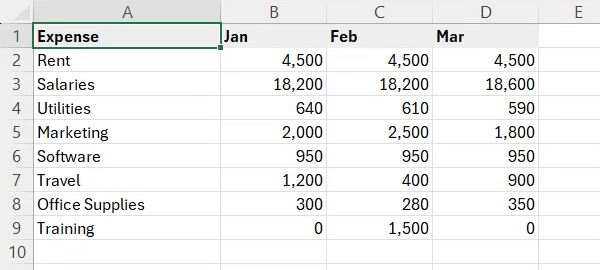
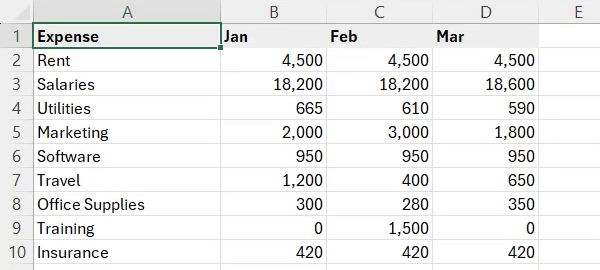
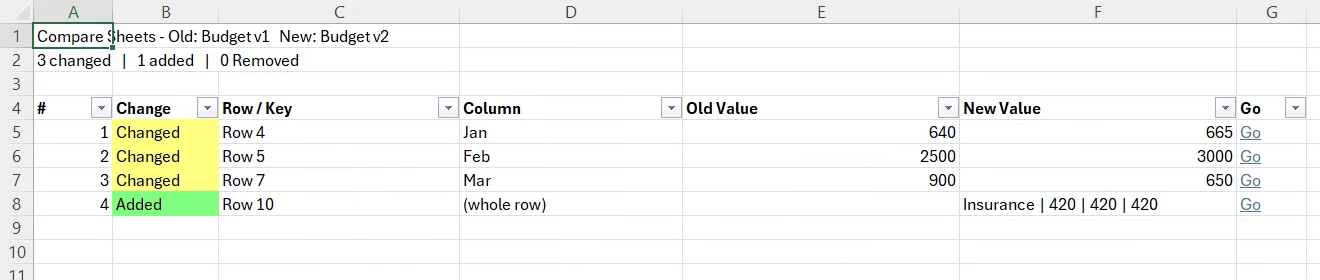
We picked Budget v1 as the old sheet and Budget v2 as the new one, chose Peer to Peer, and clicked Apply. The report lists the three revised figures by row and month, plus the new Insurance line, and the highlighted copy shows exactly where they are:
Based on Column or Peer to Peer?
Which one you need depends on your rows. Here is how to choose when you compare two Excel sheets:
| Your sheets | Use |
|---|---|
| Rows can be in any order, and each row has a unique value (code, ID, number) | Based on Column |
| Rows were sorted differently, inserted or deleted between versions | Based on Column |
| Fixed layout that never moves: budgets, timesheets, forms, templates | Peer to Peer |
| No column with unique values, and the rows stay in place | Peer to Peer |
Reading the Differences Report
Every time you compare Excel sheets, the report is a new workbook with three sheets. It’s an ordinary Excel file, so you can save it, filter it, print it or email it to whoever needs to see what changed.
- Differences shows which two sheets were compared and how many values changed, how many rows were added and how many were removed. Below that is one line per difference with its Change type, the Row / Key it belongs to, the Column, the Old Value and the New Value. The table has filter buttons, so you can show only the removed rows, or only changes in the price column.
- New Sheet is a copy of the newer sheet’s values, with changed cells in your update color and added rows in your new color.
- Old Sheet is a copy of the older sheet’s values, with removed rows in your removed color.
Click Go on any line and you land on that exact cell in the highlighted copy, so you can see the change next to the rest of its row.
Tips for an Accurate Comparison
A few habits help you compare two Excel sheets and find differences you can trust:
- Keep the column names in the first row of both sheets. Compare Sheets reads the first row as the headings, and that’s where the list of matching columns comes from.
- Use the same columns in the same order. Values are compared column by column, so if one sheet has an extra column in the middle, the columns after it won’t line up. That’s what the confirmation question after Apply is reminding you of.
- Clean up stray spaces first. SKU-1001 and SKU-1001 with a trailing space are different values, and exports from other systems are full of those. A quick pass with Remove Spaces or Data Cleaning stops them from showing up as false differences.
- Decide about capital letters. With Case Sensitive off, Mak0530 and MAK0530 are treated as the same value, both when matching rows and when comparing cells. Tick the box when the difference matters.
- Formulas are compared by their results. Compare Sheets looks at the values your cells hold, so a formula that was rewritten but gives the same answer isn’t reported, and neither are formatting changes such as fonts or fills.
When People Use Compare Sheets
These are the moments people most often need to compare two Excel sheets:
- Price lists and catalogs: see which prices went up or down this month, and which products were added or dropped.
- Stock counts: compare the system export with the count sheet and go straight to the lines that disagree.
- Budgets and forecasts: find every figure that changed between version 1 and version 2 before the meeting, not during it.
- Employee and payroll lists: spot new starters, leavers and changed salaries or departments by matching on the employee ID.
- Customer and supplier lists: check a CRM or accounting export against last quarter’s copy.
- Files that came back from someone else: see exactly what a colleague or client changed in the sheet you sent them.
- Month-end and reconciliation work: compare two system exports of the same records and get a list of every mismatch to investigate.
Demo: Compare Two Excel Sheets in Action
This tutorial shows how to compare two Excel sheets using both examples on this page: the price list matched on its product code, and the budget compared Peer to Peer.
Frequently Asked Questions
How do I compare two Excel sheets for differences?
Open the DOSE tab, click Compare Sheets, choose the old sheet and the new sheet, pick Based on Column (to match rows on a column such as an ID) or Peer to Peer (to compare row by row), and click Apply. You get a new workbook that lists every changed value, added row and removed row, plus highlighted copies of both sheets.
Can I compare two Excel files, or only sheets in the same workbook?
You can do either. To compare two Excel files, choose From external workbook for a sheet, click Browse and pick the file. You don’t need to open that file in Excel first. To compare two sheets in the same workbook, choose From current workbook for both.
Do the rows need to be in the same order?
Not with Based on Column. Rows are matched by the value in the column you choose, such as a product code or an employee ID, so they can be sorted any way in either sheet. Peer to Peer compares rows by position, so use it when both sheets keep the same layout.
Will Compare Sheets change my original sheets?
No. It only reads the two sheets. All the results, including the colored copies, go into a new workbook, so your original data, formatting and colors stay exactly as they were.
How are added and removed rows shown?
In the Differences report they appear as Added or Removed lines showing the values in that row. On the highlighted copies, added rows are colored on the New Sheet copy and removed rows on the Old Sheet copy, in the colors you chose.
Does it compare formulas or their results?
It compares the values the cells hold, so for a formula that means its result. Formatting such as fonts, fills and number formats is not compared.
Is the comparison case sensitive?
Only if you want it to be. With the Case Sensitive box unticked, ABC and abc count as the same value. Tick it and any difference in capital letters is reported.
Is there a limit to how many differences it can report?
No. Every difference is listed. If there are more than fit on one report sheet, the report simply continues on a second sheet.
Which Excel versions does Compare Sheets work with?
Excel 2010, 2013, 2016, 2019, 2021, 2024 and Microsoft 365, in 32-bit and 64-bit editions, on Windows. The interface is available in multiple languages.
Related Dose for Excel Tools
These tools pair well with Compare Sheets, before you compare or after:
More Features:
How to Clean Data in Excel: Trim, Fix Case and Convert in One Pass
Excel Data Cleaning: Spaces, Line Breaks, Capitals and Text Numbers, All in One Pane A…
Excel Extend Selection To Last Used Row
Easily Extend Selection To The Last Used Row Normally if you want to select a…
Excel Split
In Excel, split the first and last word, or divide them by a delimiter or…
Excel Reading Layout View
Highlight the Active Row & Column in Excel with One Click Reading a wide spreadsheet…
Excel Hyperlinks Sheet Names
Convert All Your Worksheets into Hyperlinks in One Worksheet Extract all sheets names as hyperlinks…
Excel Import Files Names
Import Files Names From Your Folder Into Excel Import your directory or folder files names…